 We are all changing to use big visible charts as an effective method for communication. These charts should be for things that we care about as a team and ideally are hand-drawn, wall-mounted and easy to understand.
The boards act as information radiators to anyone walking past and are a great way of building consensus and understanding within the team. Boards can be used for many different reasons and this post is an attempt to list some of them. All of these boards are temporary and should only be used whilst they serve a purpose.
Create boards anywhere, on walls, over glass, around pillars or freestanding. You can use mounted or movable whiteboards, foldable cardboard, whiteboard paint, magic whiteboard (static film). I have only listed physical ideas here and will cover electronic ones in a later post. Board types I have used are as follows:
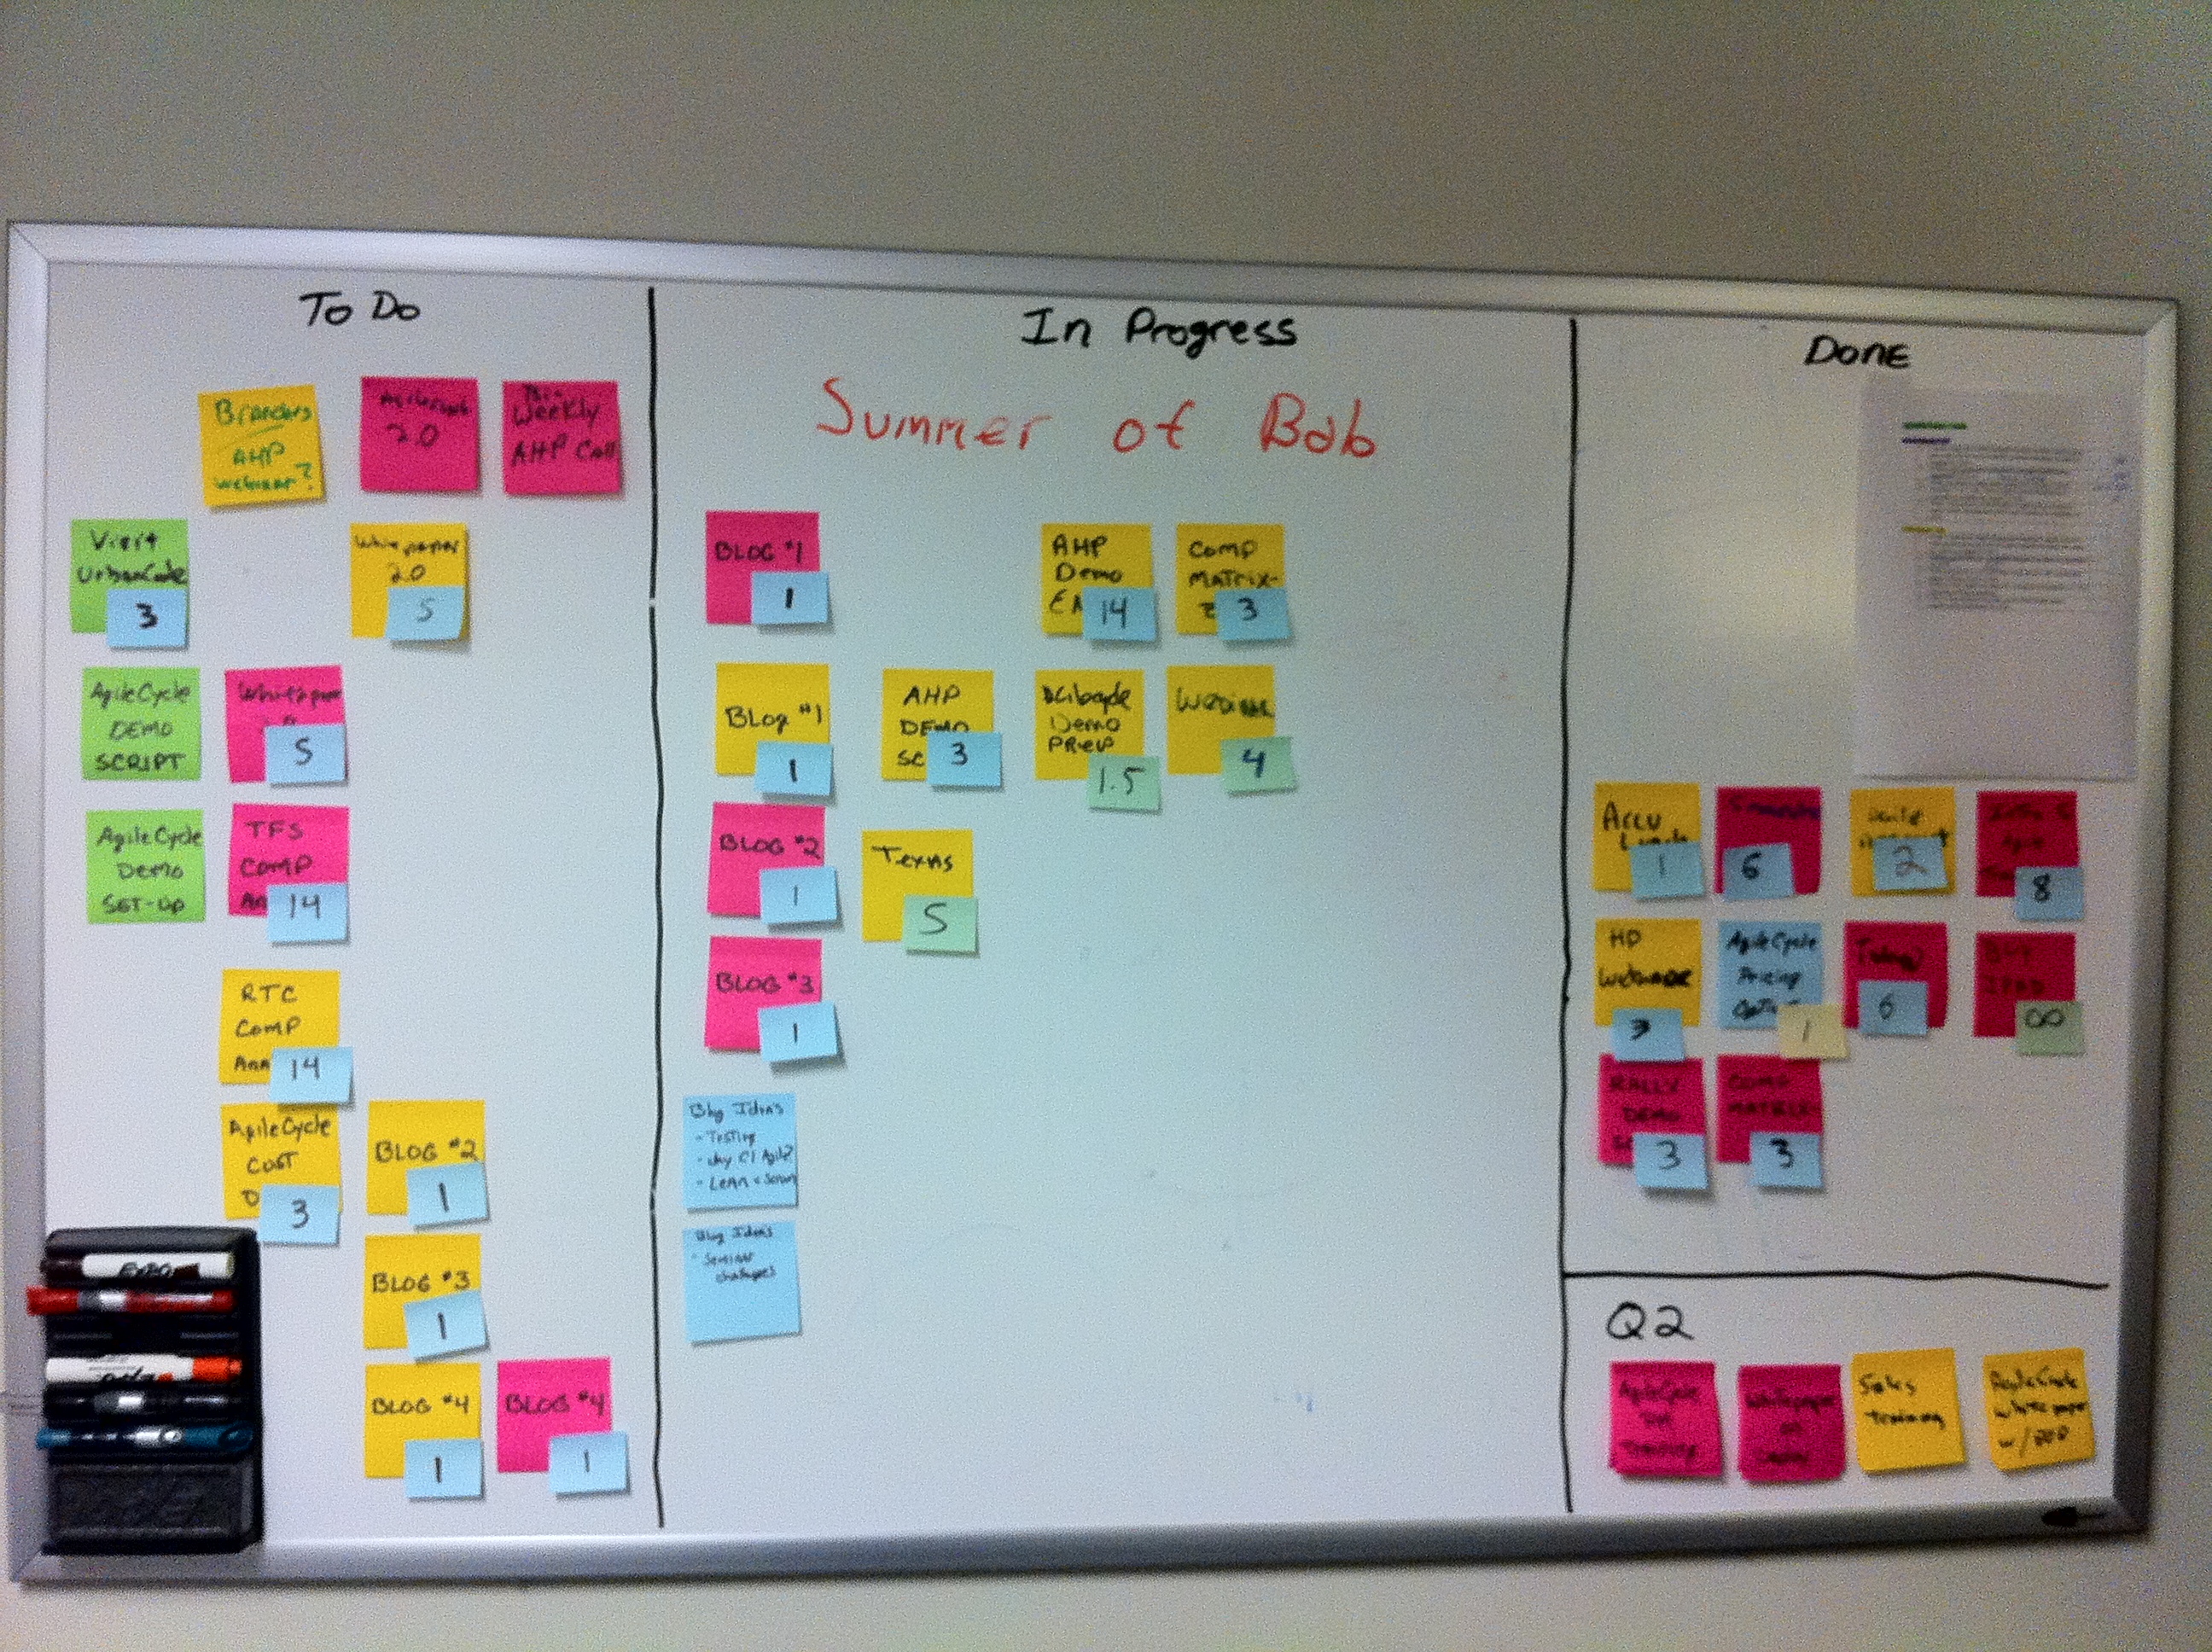
Type: Task Board / Scrum Board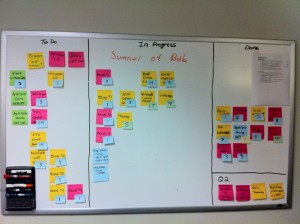
Function: The standard Kanban board show the current state of the Sprint and acts as a focus to the team during development.
Notes: As well as stories and tasks the board normally includes the sprint goal and end date, retrospective actions, sprint burn down, holidays and absences, Definition of Done and Definition of Ready. Avatars, work in progress limits and identification of blockers can also all be shown on the board.
Type: Program Board / Portfolio Board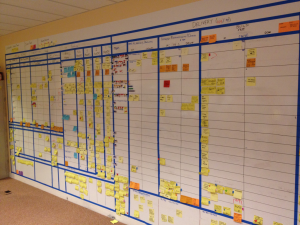
Function: We can create boards at a higher program or portfolio level to give a bigger picture view to activities. This can include vision, full idea generation, approval process, engineering and delivery (if you have the space). By including the full life cycle, from concept to cash (Mary & Tom Poppendieck), we can work better together as a company to drive value
Notes: Look to Obeya (‘large room’ or ‘war room’ in Japanese) to give visibility to the entire development process.
Type: Feedback Wall (Niko-Niko Calendar/Happiness Index)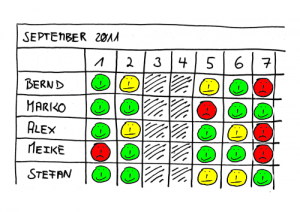
Function: This is a method for tracking the mood of the team through a sprint as data to take into the retrospective.
Notes: Create a calendar with a square per team member for each day of the sprint (see picture). Ask each team member to draw a face on the chart to represent their mood as they leave each day. This data aids reflection within the sprint retrospective.
Type: Idea Board / Innovation board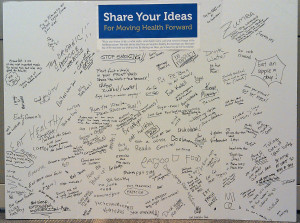
Function: Instead of waiting for the sprint retrospective; make an area for anyone to record new ideas at any time. An area for successfully implemented ideas can also reinforce positive behaviours.
Notes: By writing ideas during the sprint we can find a wider range of ideas. This technique can be used to ensure ideas generated during a sprint are not lost by its end.
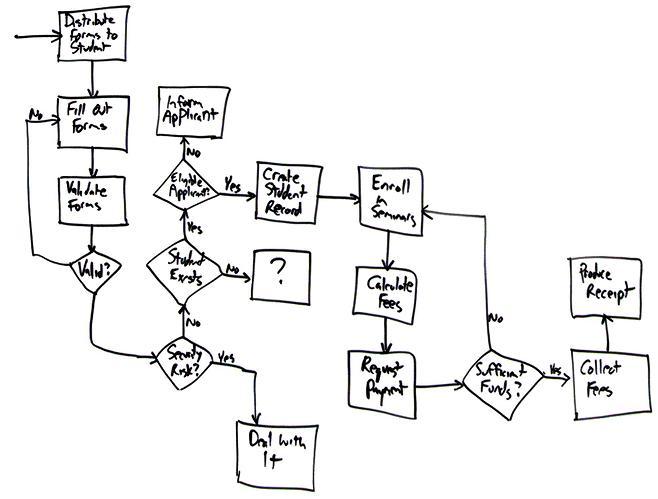
Type: Modelling Board / Design Boards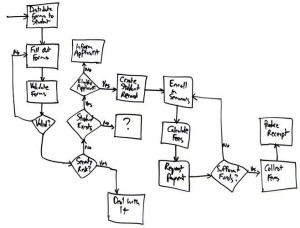
Function: Agile modelling allows interested groups to gather around a whiteboard to create and evolve a model for the system being developed. This is a quick and visible method that allows wider involvement and input post-meeting by others who see the board.
Notes: Photographs of the model/design is often sufficient as a record when stored to a shared wiki.
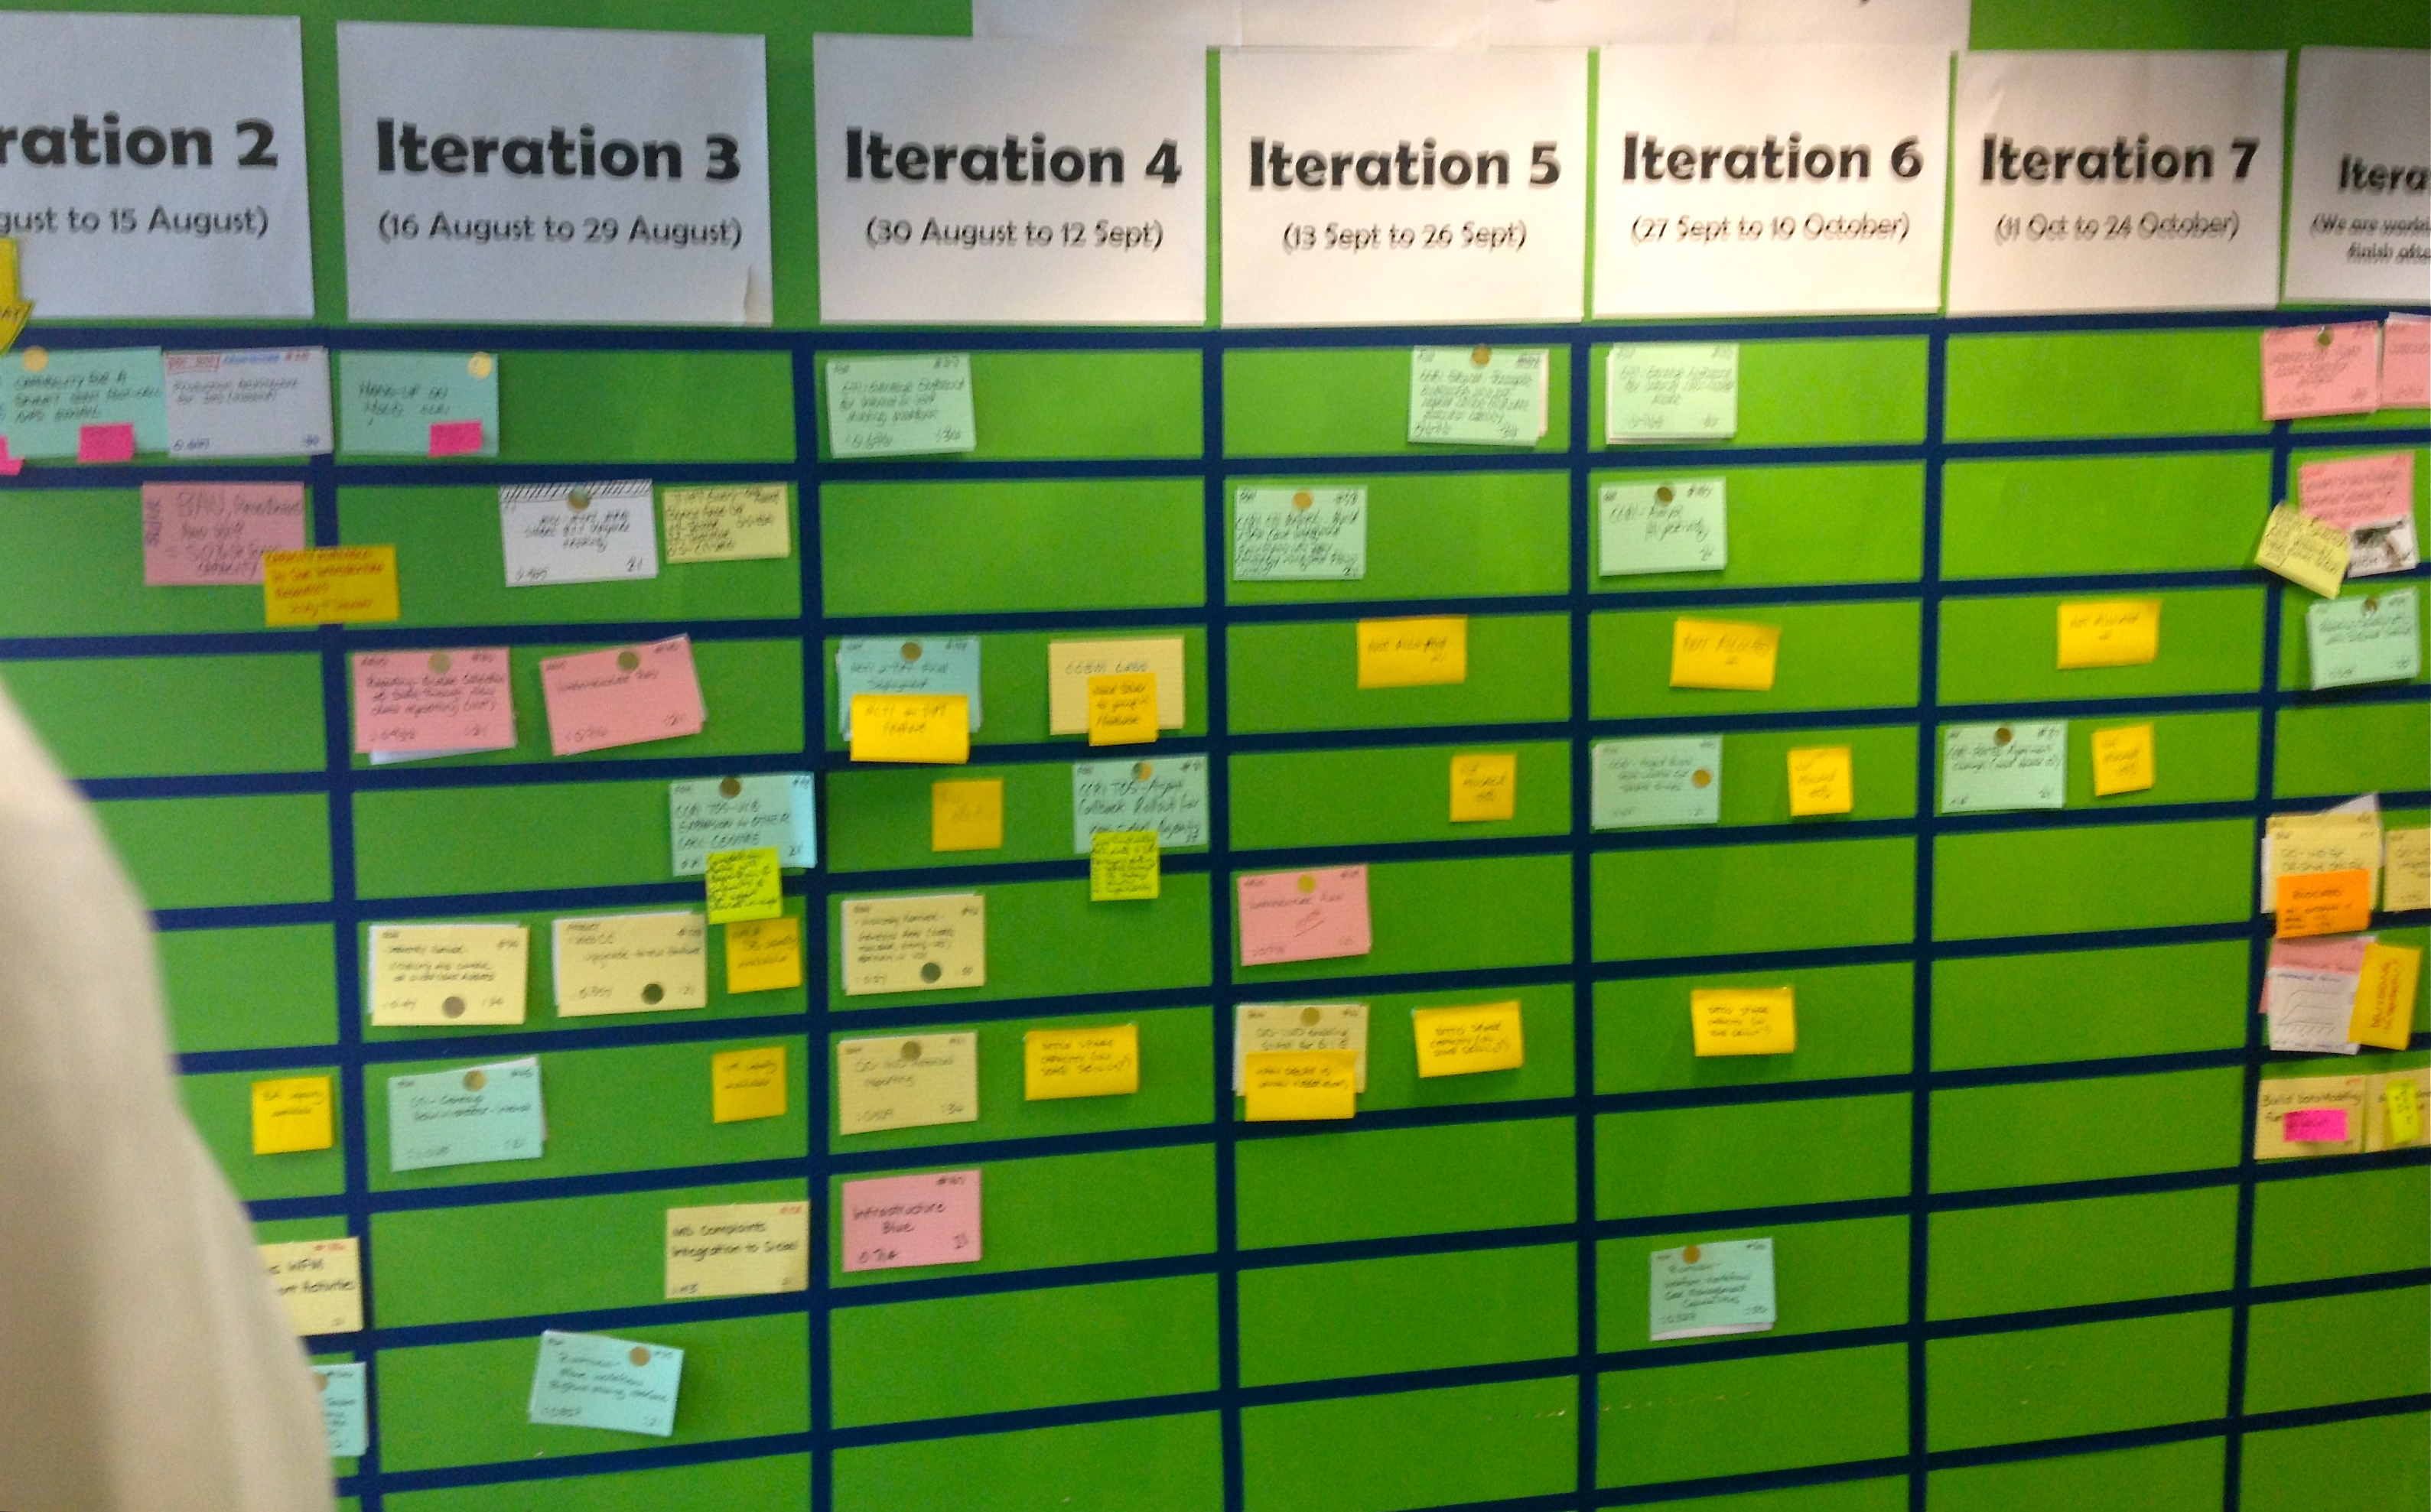
Type: Release Board (alternatively Feature Board)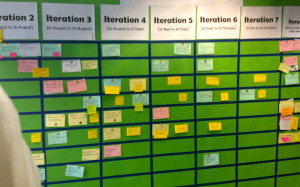
Function: A representation of the current state of the release split by sprints with burn-up charts. This can be elaborate with a full breakdown of the backlog into releases, sprints or a more agile breakdown of the current release only with focus only on the next three sprints.
Notes: This chart can be broken down for a release or by feature.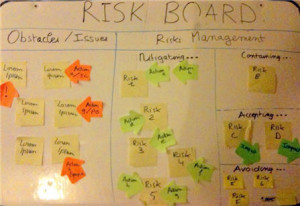
Type: Risk Board
Function: A visualisation of the risks present upon a project.
Notes: As well as the identification of the risks, the mitigation activities can be tracked along with a graph of overall risk exposure and trends.
Type: Happiness Door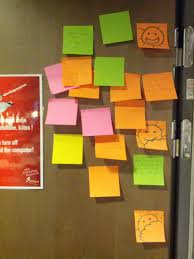
Function: A Management 3.0 method for collecting engagement and satisfaction for meetings as people leave. This collects information in order to make the events more valuable to everyone that attends them.
Notes: Place three satisfaction indicator graphics onto the door (happy, neutral, sad – sunny, cloudy, rain or any other set of three) and ask everyone to write a post-it summarising their thoughts on the meeting and post it onto the appropriate place door as they leave.
Type: User Story Map (Story Mapping)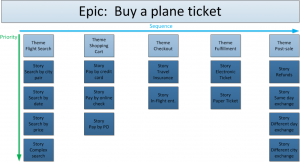
Function: A user story map is a grid containing a systems functionality allowing better release planning. Visualising structure enables a higher-level product view solving a potential issue with iterative development.
Notes: Functionality (user activities) is listed horizontally along the top of the grid from left (high priority) to right (low priority). Vertically tasks are added below the related user activities. Releases and sprints can then be determined by prioritising and ordering this work on the board.
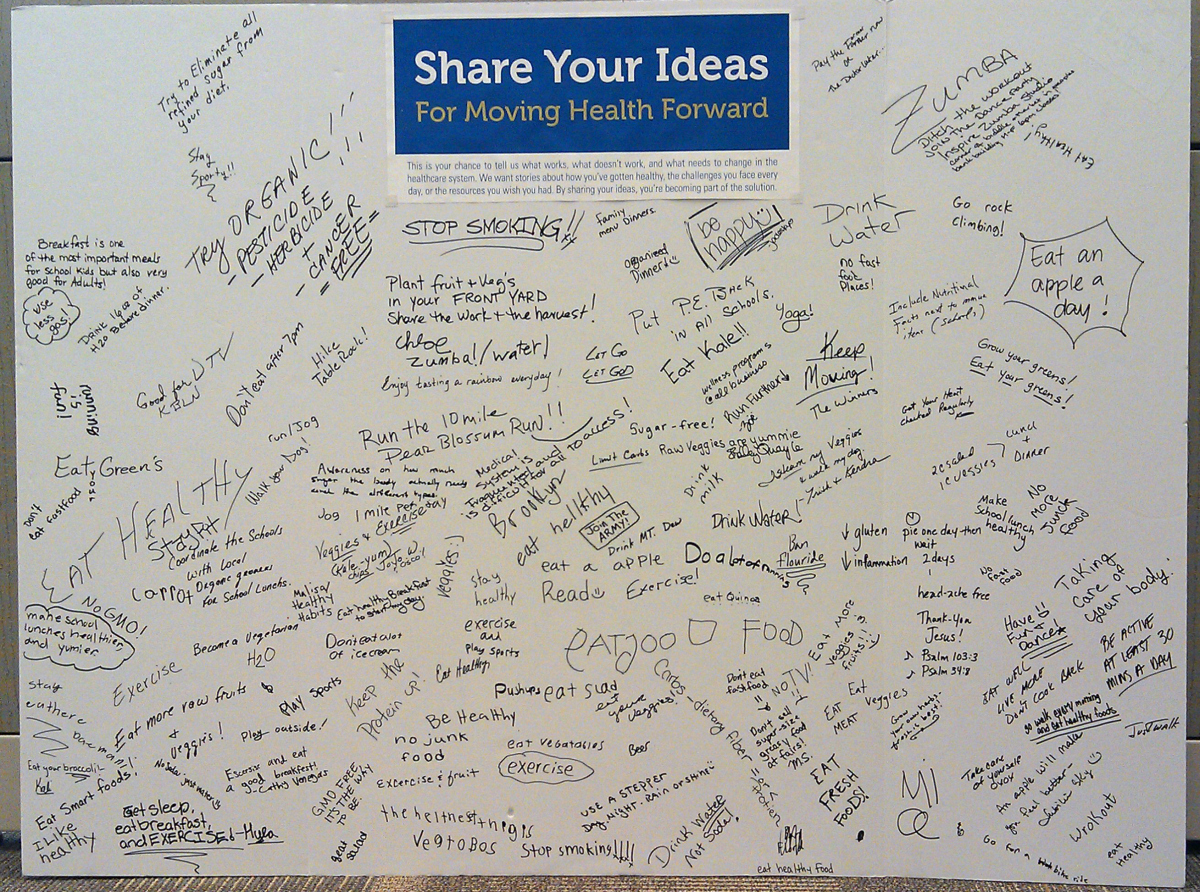
Type: Affinity Wall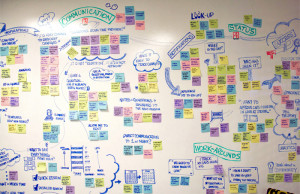
Function: Used to organise and categorise information into logical groups.
Notes: Following brainstorming the team organises post-its into related themes and then titles each group. This method allows visual clarification of problems and identification of potential solutions.
I would love to hear about other visualisations that aid projects so if there is a board type that you use that I have not listed then please add a comment containing a description.
 Over the past couple of years, I have made the time to seriously read books within the Agile domain. I have been surprised by both the number of books available and the variability in their quality.
 I wanted to examine how teams that regularly fail to deliver forecast work erode trust within an organisation. When a team has eighteen completed sprints without ever meeting a sprint goal then you know that there are hidden issues.
 ong a task will take based upon your current knowledge’, occasionally sprints goals will not be met but this should be the exception. The late and great Douglas Adams said “I love deadlines. I like the whooshing sound they make as they fly by”. Fortunately in Scrum the deadlines are always fixed for sprints but the quantity of work delivered can vary due to many reasons including hidden complexities, unknown dependencies, sickness or misunderstandings.